


The United States bought the terminals. It never finished the cables. (Illustration created for this article.)
Two numbers should frame every conversation about health information technology in the United States.
The first: 9%. That was the share of American hospitals operating even a basic electronic health record in 2008, according to the federal government’s own retrospective tally (ASTP/ONC QuickStats) – a figure grounded in the landmark DesRoches survey, which found 1.5% of hospitals with a comprehensive record and 7.6% with a basic one (Harvard Gazette).
The second: 43%. That is the share of U.S. hospitals that were routinely interoperable on four key dimensions: able to reliably find, send, receive, and integrate patient records with outside organizations – as of 2023, the most recent national measurement (ASTP/ONC Data Brief 71).
Between those two numbers sits roughly $38 billion in federal incentive payments, years of rulemaking, and a policy achievement that is real but persistently misread. The United States solved adoption. It has not solved exchange. The United States paid to put computers in every hospital and assumed the wiring would follow. It didn’t. Adoption is not the same thing as interoperability, and conflating the two cost us 15 years.
Understanding why requires looking beyond Washington, because most of the developed world reached the American starting line before the American program began.
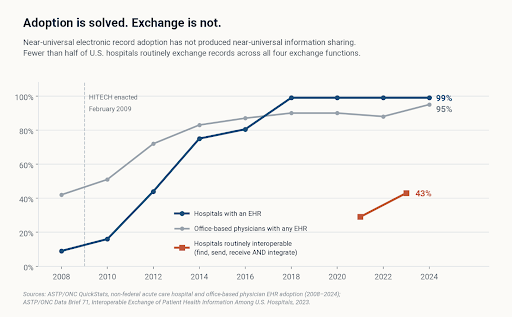
Figure 1. Adoption is solved; exchange is not. Sources: ASTP/ONC QuickStats on hospital and office-based physician EHR adoption; ASTP/ONC Data Brief 71.
Everyone else got there first
The developed economies (OECD countries) that computerized clinical records early did so quietly, inexpensively, and without a national incentive program.
- Norway’s first general-practice electronic record, ProMed, was in use in the late 1970s, and Norwegian GPs reached 95%–98% coverage by 2002 (review of Norwegian EHR history).
- Sweden had electronic records in 85% of its primary care centers by 1994, spread across 27 competing commercial products (INRIA history of Swedish health informatics).
- In the Netherlands, 38% of GPs had computer-based patient records by mid-1992 (van der Lei et al.).
- New Zealand introduced a national patient identifier in 1992 and a national electronic referral and results network in 1993.
Denmark is the most instructive case study. MedCom, the Danish Centre for Health Telematics, was created in May 1994 and made permanent in 2000 (MedCom). By 2006, 98% of Denmark’s roughly 3,500 general practitioners were exchanging clinical messages electronically – 3.5 million messages a month, including 100% of hospital discharge letters and 95% of laboratory results (Commonwealth Fund case study, Protti and Johansen). Today more than 90% of clinical communication between Danish primary and secondary care is electronic, and the national citizen portal, sundhed.dk, logged 44 million visits in the first nine months of 2024 (Healthcare Denmark).
Estonia went further with less. Its e-Health Record launched in December 2008 on the X-Road data exchange backbone deployed nationally in 2001, and its e-prescription system, live in 2010, reached 84% uptake in its first year and 99% or better by the end of the decade (WHO Europe / Eurohealth). Estonia and Finland became the first EU states to honor each other’s electronic prescriptions across a border, beginning in January 2019.
The United States, by contrast, did not launch a national health IT strategy until 2006 – more than a decade behind Germany’s 1993 start, and years behind Canada, Norway, and Australia.
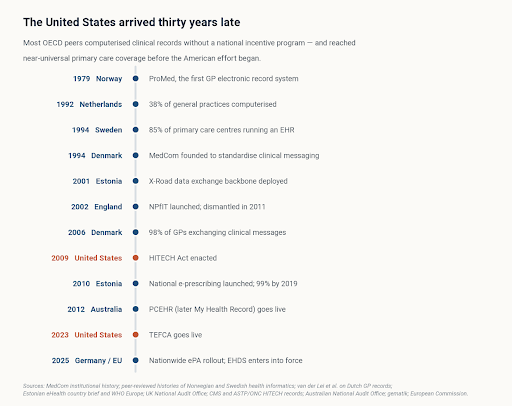
Figure 2. Four decades of national digital health milestones. Sources: MedCom institutional history; Norwegian EHR history; INRIA history of Swedish health informatics; van der Lei et al.; WHO Europe / Eurohealth on Estonia; UK National Audit Office; Australian National Audit Office; gematik; European Commission.
Spending is not capability
Spending has not bought capability, despite being the American assumption. The international numbers demonstrate this repeatedly.
The U.S. spends 16.6% of GDP on health, the highest in the OECD, at roughly $12,555 per capita against an OECD average near $5,000; Germany is second at 12.7% (OECD Health at a Glance 2023). Yet when the OECD examined which countries can actually link to, and reuse national health data, Denmark and Norway had full availability of all 10 key dataset types tracked, while Germany and Ireland conducted no regular data linkages at all (OECD, Health at a Glance: Europe 2024). An earlier OECD working paper identified the small group of countries with both high data governance and high technical readiness – Canada, Denmark, Finland, New Zealand, Norway, Poland, and Sweden among them (OECD Health Working Paper No. 99). The list is dominated by mid-level spenders.
Big money has, in fact, repeatedly bought failure. England’s National Program for IT, launched in 2002, was estimated at £12.7 billion by 2008 and £11.4 billion by 2011, with £6.4 billion actually spent, according to the National Audit Office, before the government announced its dismantling in September 2011 (National Audit Office; GOV.UK). Parliament’s Public Accounts Committee called it “one of the worst and most expensive contracting fiascos in the history of the public sector,” noting that after roughly £3.1 billion committed to one supplier, “not a single trust has a fully functioning Lorenzo care records system” (Public Accounts Committee, 19th Report, September 2013).
Australia has spent roughly A$2 billion on My Health Record, with annual running costs near A$500 million (Australian National Audit Office). After offering citizens the ability to opt-out in 2018-19 – 9.9% of Australians opted out: 71% of surveyed GPs called it a failure and 35% said they never use it to look up patient information (Healthed, 2024).
Germany legislated electronic records in 2004, founded gematik in 2005, and did not begin a nationwide rollout of its opt-out ePA until April 29, 2025 (gematik) – with active use still in the low single digits, according to subsequent government reports to the Bundestag (Bundestag Drucksache 21/3769).
Canada put $2.1 billion through Canada Health Infoway and reached 93%-95% physician EMR adoption, yet more than 70% of electronic health information still is not shared among providers, and only 39% of Canadians could view their own records online in 2022-23 (Policy Options/IRPP; Competition Bureau of Canada).
Countries that achieved interoperability did it by building standards and governance first – not by spending more.
Where the American money actually went
HITECH, enacted within the 2009 Recovery Act, had two distinct funding streams, and conflating them has muddied a decade of debate.
The larger stream was open-ended Medicare and Medicaid authorizations. The Congressional Budget Office (CBO) estimated gross incentive spending of roughly $30 billion for 2011-2019 – about $17.7 billion Medicare and $12.4 billion Medicaid – against a net effect on the budget deficit of $16.8 billion to $17.1 billion after projected savings (CBO letter to Rep. Waxman; GAO-12-481). Actual payments exceeded the projection. CMS data showed $34.7 billion disbursed by May 2016 and $38.2 billion by May 2018, to 545,602 unique providers including 5,006 hospitals – of which $20.6 billion went to hospitals as of the 2016 tally (CMS Medicare incentive payment report, April 2018). Because Medicaid paid the final incentives in December 2021, and the Medicare hospital program continues as an open-ended payment adjustment, no single clean lifetime total exists; $38 billion is the best-documented, low-bar estimate.
The smaller stream within HITECH, roughly $2 billion in discretionary money to the Office of the National Coordinator (ONC), is where the interoperability work was supposed to happen. Information exchange was outspent by adoption incentives roughly 19 to 1 ($38 billion to $2 billion). Regional Extension Centers received $643 million to $677 million and enrolled about 134,000 primary care providers, 44% of the national total (HHS OIG audit of the Texas REC; peer-reviewed REC evaluation). The State Health Information Exchange (HIE) Cooperative Agreement Program received $564 million, and an independent evaluation by the National Opinion Research Center (NORC) at the University of Chicago found that the national HIE readiness composite ranking rose from 36% in 2010 to 79% in 2014 (NORC evaluation). The $250 million Beacon Community Program, across 17 communities, produced what its own evaluators called mixed progress on quality measures.
The United States threw money at software but treated interoperability as an afterthought – funded at a twentieth the level, with the results to match. It got exactly what it paid for.
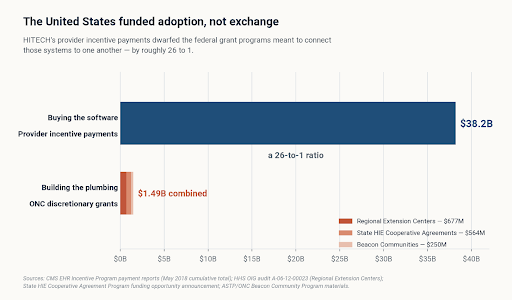
Figure 3. Where the HITECH money went. The three named exchange-focused or interoperability grant programs total $1.49 billion against $38.2 billion in provider incentives, a 26-to-1 ratio; measured against ONC’s full discretionary appropriation of roughly $2 billion, the ratio is about 19 to 1. Sources: CMS Medicare incentive payment report; HHS OIG audit A-06-12-00023; NORC evaluation of the State HIE Cooperative Agreement Program.
The bill came with a fraud tail. HHS’s Inspector General estimated $729 million in Medicare incentive payments went to professionals who did not meet meaningful use requirements between 2011 and 2014 – about 12% of the payments reviewed (OIG A-05-14-00047) – and a further $93.6 million in incorrect hospital payments (OIG A-09-18-03020). The Justice Department extracted more than $275 million in False Claims Act settlements from vendors that misrepresented certified capabilities, including $155 million from eClinicalWorks in 2017 (HHS OIG), $145 million from Practice Fusion in 2020 for a scheme that included opioid-manufacturer-sponsored prescribing alerts (DOJ), and $31 million from NextGen in 2023 (DOJ).
Where we actually are
The adoption story appears to be complete. Hospital electronic record use stands at 99% and office-based physician adoption reached 95% in 2024 (ASTP/ONC QuickStats). Three vendors now supply four out of five hospitals, with Epic at 43.7% of acute care hospitals and 56.9% of beds in 2025, and Oracle Health at 21.9% (Becker’s Hospital Review). One peer-reviewed analysis dates the market’s shift from competitive to highly concentrated to the post-2018 period (Herfindahl-Hirschman analysis).
The exchange story is genuinely improving. The Trusted Exchange Framework and Common Agreement (TEFCA) went live in December 2023 with five Qualified Health Information Networks (Sequoia Project); the network has grown to 11 QHINs and moved from roughly 10 million documents before 2025 to nearly 500 million records exchanged by February 2026 (HHS), with 80% of hospitals participating or planning to (ASTP/ONC 2026 Annual Meeting). Certified systems have been required to expose HL7 FHIR R4 APIs since December 31, 2022 (ONC), and the CMS Interoperability and Prior Authorization rule requires payers to stand up four FHIR APIs by January 2027 (CMS-0057-F).
It’s the distribution of that progress that healthcare leaders should be paying attention to. Routine interoperability reaches 53% of large hospitals and 53% of system-affiliated hospitals, against 38% of hospitals under 100 beds, 36% of rural hospitals, 37% of critical access hospitals and just 22% of independent hospitals (ASTP/ONC Data Brief 71). Integration remains the weakest of the four exchange functions, with 22% of hospitals not engaging in it at all. Even among hospitals that are routinely interoperable across all four functions, outside information was available at the point of care 92% of the time but actually used only 70% of the time; across all hospitals, only 42% report using it “often.” And exchange with long-term post-acute care and behavioral health providers remains frustratingly thin because these are the settings where care transitions fail and where the greatest gains in economic and social value could be realized.
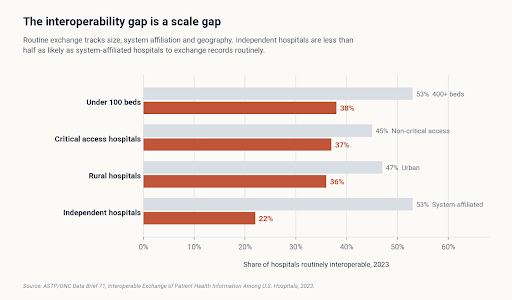
Figure 4. The interoperability gap is a scale gap. Source: ASTP/ONC Data Brief 71.
Meanwhile, enforcement of interoperability standards has been theoretical. The OIG’s rule authorizing penalties of up to $1 million per information-blocking violation took effect on September 1, 2023 (HHS OIG), and provider disincentives took effect on July 31, 2024 (Federal Register). ONC’’s portal has logged 2,450 possible information blocking claims since April 2021 (ASTP/ONC). Not one publicly disclosed financial penalty has followed; investigations of health IT developers only began issuing notices in early 2026 (Healthcare Dive; Holland & Knight). The country also still lacks a national patient identifier, blocked by an appropriations rider dating to 1999, while duplicate-record rates run in the high single digits within institutions and are far worse across unaffiliated ones (ONC patient matching white paper).
The regulatory direction has turned. HHS withdrew the remaining HTI-2 proposals on December 29, 2025 (Federal Register), proposed removing 34 certification criteria and narrowing information blocking exceptions in HTI-5, and on March 31, 2026 reversed the 2024 reorganization that had created ASTP/ONC (NextGov). Europe is moving in the opposite direction: the European Health Data Space entered into force March 26, 2025, mandating a common EHR exchange format, national digital health authorities, and EU-wide exchange of patient summaries and prescriptions by 2029 (European Commission).
The lesson worth $38 billion
The clinical consequence of all this is measurable and unflattering. In the Commonwealth Fund’s 2019 international survey of primary care physicians, 49% of U.S. doctors received information about medication or care plan changes from specialists treating their patients, versus 77% in New Zealand, 73% in France, and 69% in the U.K.; 48% were notified when their patient visited an emergency department, versus 85% in New Zealand and 84% in the Netherlands (Commonwealth Fund). The Fund’’s 2024 cross-national comparison still ranks the U.S. last overall (Mirror, Mirror 2024).
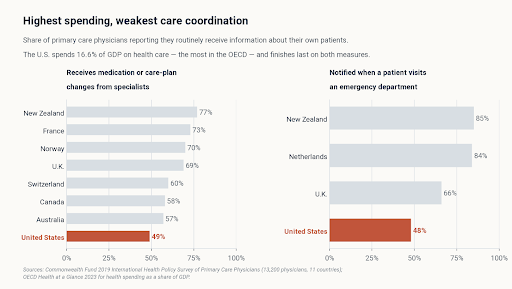
Figure 5. Highest spending, weakest care coordination. Sources: Commonwealth Fund 2019 International Health Policy Survey of Primary Care Physicians; OECD Health at a Glance 2023.
This in no way suggests that HITECH was a mistake. Moving from 9% to 99% hospital adoption in a decade was a genuine act of state capacity, and no country has done it faster. The error lies in subsidizing the purchase of proprietary systems before establishing the infrastructure, exchange obligations, and enforcement teeth that would make those systems talk to one another. Denmark spent a fraction of what America did and got there 20 years earlier because it started with the standards and worked backward to the software.
For healthcare executives, the practical implication is that interoperability is no longer primarily a procurement question. The federal framework now exists; the gaps are in the willingness to use it, the workflow for absorbing external data once it arrives, and the organizations that the incentive era never fully reached. The 30% of hospitals that are not fully interoperable, the 58% of clinicians who do not routinely use outside data even when it is available, and the long-term care providers who were excluded from adoption incentives are not waiting on another rule. They are waiting for someone to decide it matters.
Note on figures. Incentive payment totals reflect the most recent detailed CMS reporting (May 2018); because Medicaid incentives continued through December 2021 and the Medicare hospital program remains open-ended, $38.2 billion should be read as a documented floor rather than a lifetime total. National interoperability rates are from ASTP/ONC’s 2023 hospital survey, the most recent published measurement. Vendor market share figures originate in KLAS Research’s annual acute care market share reports as reported in trade press. TEFCA exchange volumes are as of HHS reporting in February 2026 and have continued to grow.